Inventory Report
Track every inventory change with full transparency. Whether you’re reviewing a stock transfer, a vendor return, or a blind count adjustment, this app captures exactly what changed, when it happened, and who made it.
Reports
- Auditing & Control
- Inventory and Stock
- Location-Based Inventory
- Operational Status Dashboard
- On-Hand Inventory
- Inventory Turnover
- ABC Classification
- Items to Reorder & Order Items Report
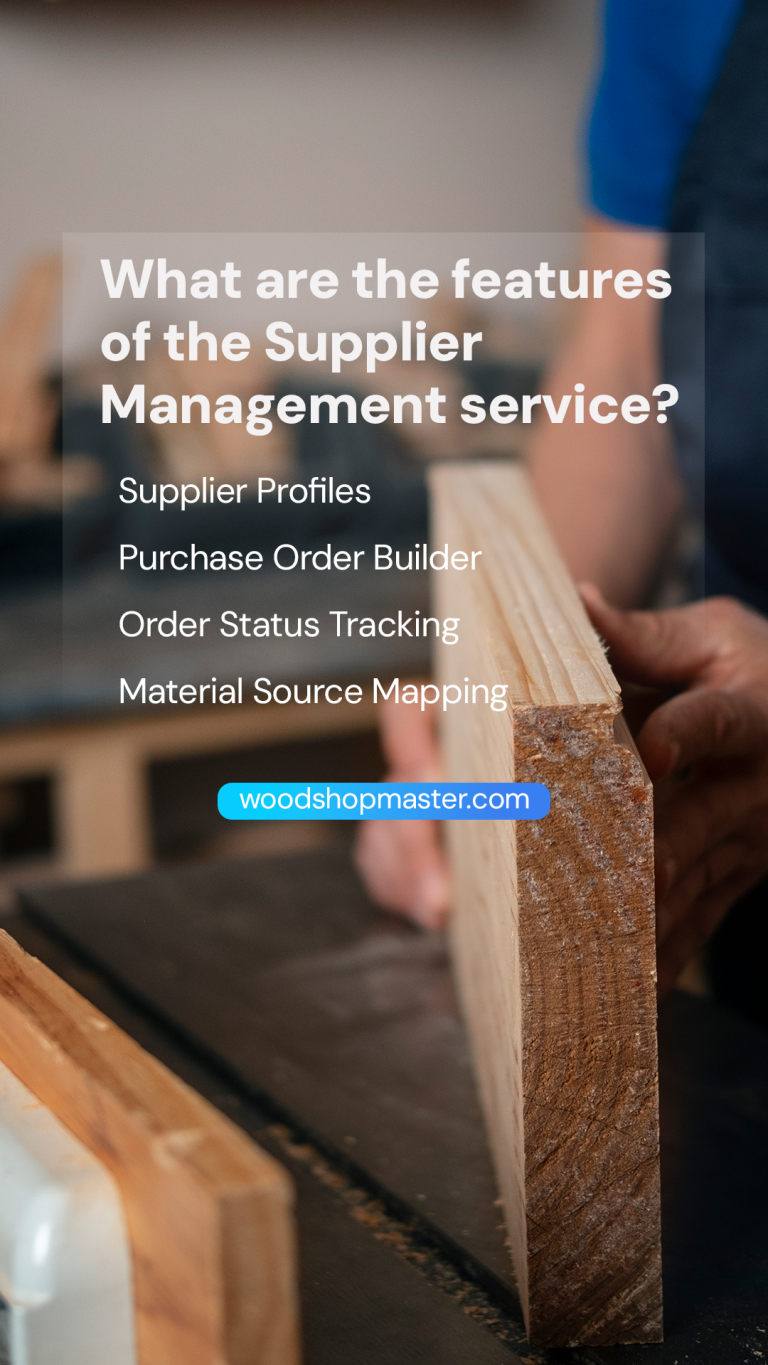
- Supplier Performance Scorecards
- On-Hand vs. Reorder (Replenishment)
- Inventory Aging by Lifecycle
- Storage Movement History (Check-in/out trail)
- Inventory Usage Log (Consumptions)
- Vendor Catalog & Last Order
- Image/PDF/Video Coverage (Content audit)
- Valuation by Lifecycle Status
- Fast-Moving Items (by Usage Qty in Period)
- Dead/Slow Stock
- Duplicate Barcodes / SKUs
- Orphan Storage Rows (No Matching Inventory)
- Inventory Backorder
- Content Coverage by Location (Image/PDF/Video)
- On-Hand vs. 30-Day Usage Coverage (Days of Supply)
- Items Without Any Storage (Not Stored Anywhere)
- Last Movement Per Item (Most Recent History)
- Movement Volume by Region/Station (Period)
- Regional Stock Imbalance (Max–Min On-Hand per Item)
- Usage by Purpose (Period)
- Top Users by Consumption (Period)
- Vendor Spend Summary
- Vendor Lead Time KPI
- Items Without Any Vendor Mapping
- Items Missing Any Content (QC list)
- Shelf Utilization (Occupied Shelves per Station)
- Items with Negative / Suspicious Quantities
- Storage vs. Lifecycle Status Mismatch (e.g., statu)
- First-Seen vs Most-Recent Movement (Cycle Time Bet)
- Station-Level Top N Items by Value
- Items With Recent Movement But No Recent Usage (Po)
- Inventory Master List (by Location and Status)
- Storage Utilization (Region/Station/Location)
Turnover Ratio by SKU, Category, or Location
Track how often each item moves — and where movement slows.
Highlight Top Movers and Slow Sellers
Color-coded indicators show what’s flying off the shelf — and what’s not.
Flexible Timeframes
View monthly, quarterly, or custom-range turnover stats.
Visual Dashboards
Trendlines, bar graphs, and category breakdowns provide instant insight.
Exportable Reports
Share actionable data with purchasing and finance teams.
Integrates with Reorder Logic
Tie movement rates directly into safety stock and reorder planning.
Filter by Vendor, Warehouse, or Product Class
Drill into turnover performance with detailed, customizable views.
Overlay Inventory Age and Value
See which slow movers are also costing you space and carrying cost.